System and Installation Requirements for PathWave IV – KEYSIGHT PW9251A Software
Computer operating system |
|
| Windows 10,11 | 64–bit (version 1809 or later) |
| Computer hardware | Minimum processor: Intel Core i3 (or equivalent)
RAM: 4 GB Recommended processor: Intel Core i5 (or equivalent) RAM: 8 GB Storage: 900 MB free space for Windows |
| Interfaces | USB, GPIB, LAN,
RS-232 |
| Display resolution | 1280×1024 minimum recommended for single instrument view (higher resolution recommended for multiple instrument view)
1920 x 1080 minimum |
| Data exports to Excel or csv | Pathwave supports Microsoft Office 2003 and later |
Pathwave IV Curve measurement software
PathWave IV Curve is a powerful GUI software designed to simplify and accelerate the process of performing synchronous current-voltage (IV) measurements. With a user-friendly interface, the software enables researchers, engineers, and developers to perform IV measurements without any programming knowledge.
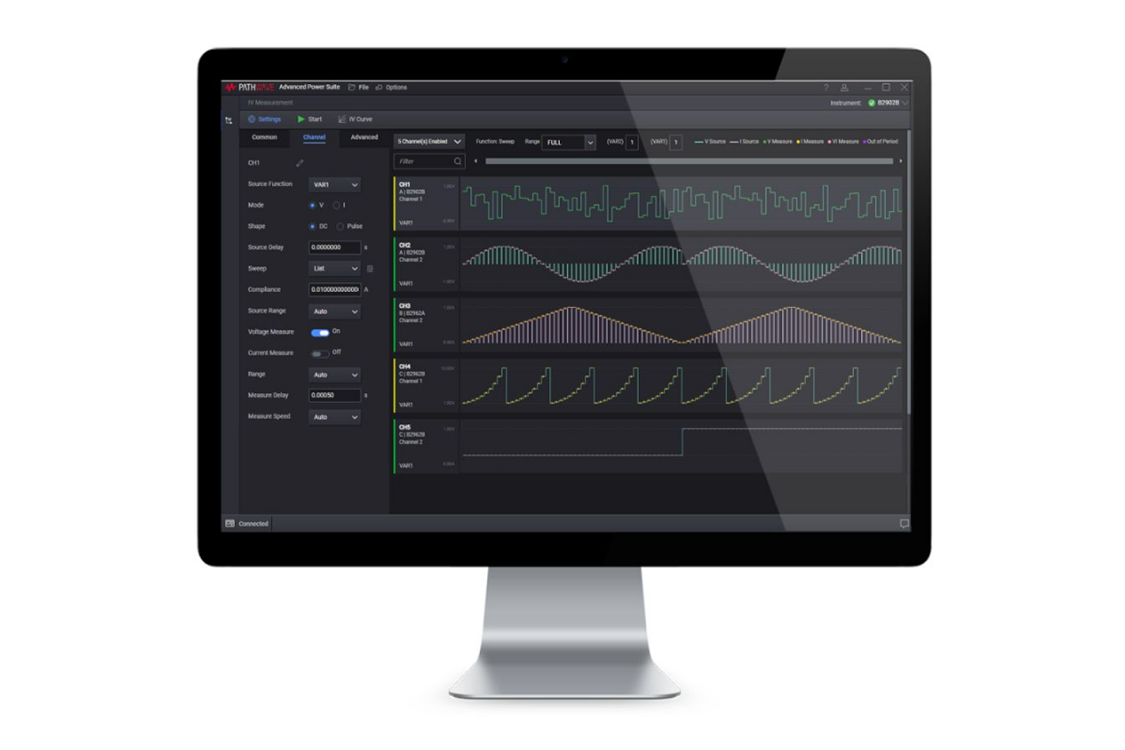
Synchronous Current-Voltage (IV) Measurements With Graphical Results
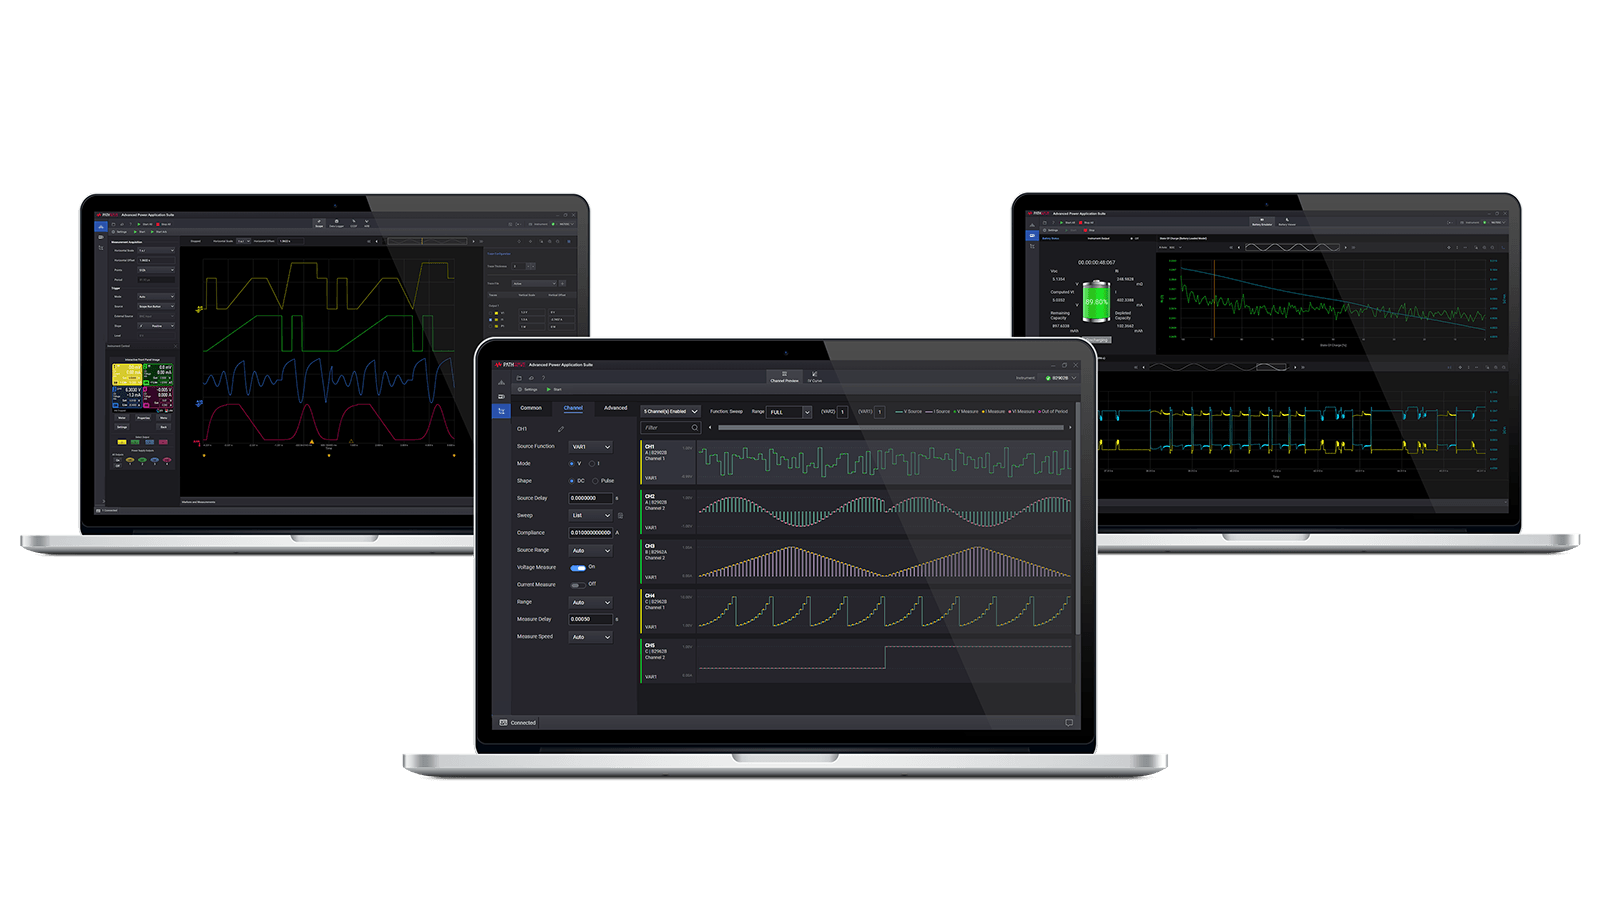
The PathWave IV curve is a ready-made GUI software to perform a variety of synchronous current – voltage (IV) measurements on up to 40 channels without programming. Various analysis functions on graphs and tables allow users to review test results immediately after the measurement. Export functions of graphs with markers and tables support efficient reporting. In addition, the test result files contain all the settings, allowing users to accurately review and repeat the test.
The PathWave IV curve accelerates your research, development, and design verification with increasing productivity, enabling more accurate and reliable data acquisition and more efficient use of the equipment.
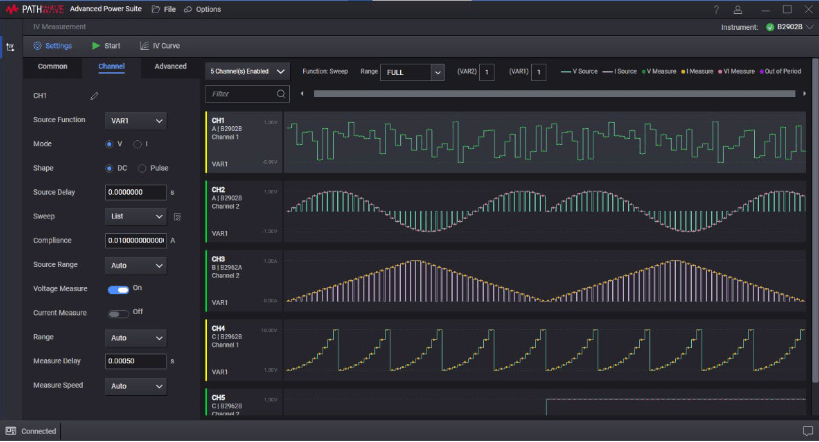
Powerful setup menu for maximum flexibility
The setup menu allows you to specify and preview the settings on multiple SMU channels before you perform a measurement, giving you the flexibility and ease of setting up the SMU channels.
Improve efficiency with the built-in graph function
The built-in graph function supports basic and advanced features, enabling immediate review of the test results through graphs with markers.
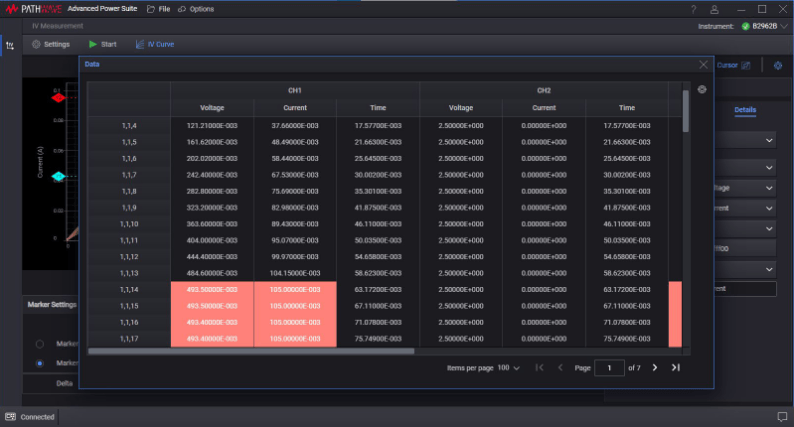
Post-processing at ease
View numerical measurement results in a table format. You can easily export these data into an Excel spreadsheet for post-analysis.





Đánh giá
Hiện tại không có đánh giá nào.